Monitoring the Test Run
Monitoring the Load Test
Test Status
The Status tab contains an overview of the test status. This is a list of the steps carried out in the load test phases Preparation, Execution, and Results and Clean Up which will be marked done while the test progresses.
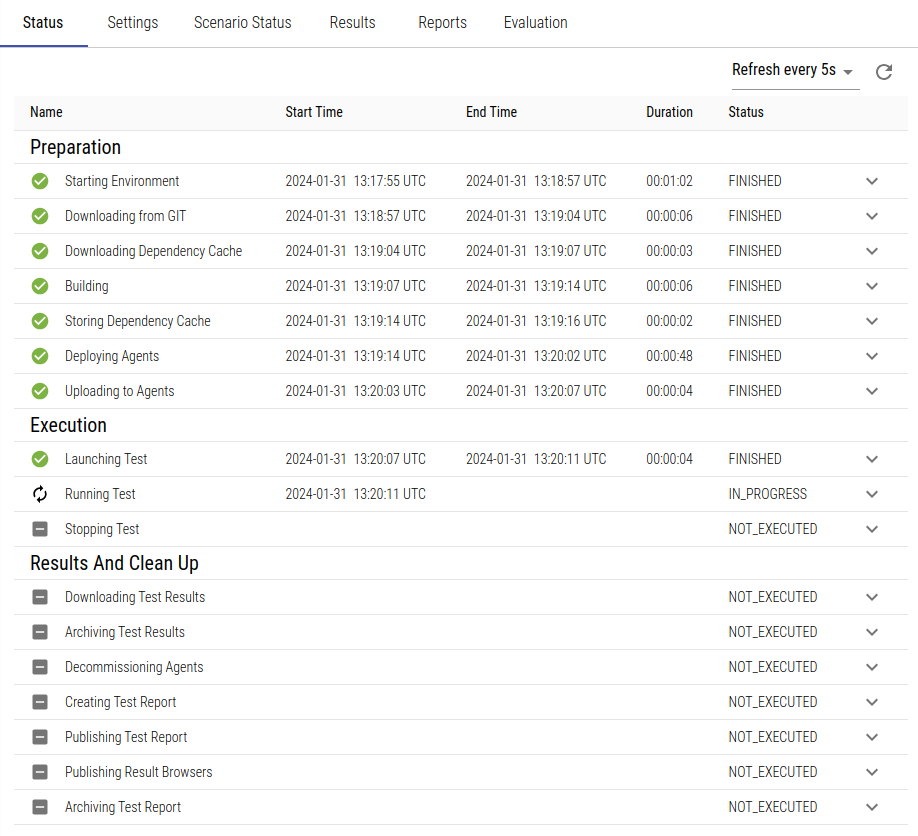
The status view for a running load test.
Steps that failed due to errors (like timeouts or failed authentication) will be marked as failed here, so you can see why and at which step the test does not progress or was aborted.
Scenario Status
The Scenario Status tab only contains information while the test is actually running or finished. After the live metrics follows an overview of all test scenarios that are executed in this load test, containing scenario name and state and other useful information such as currently running users, average scenario runtime and especially the number of events and errors that occurred in this scenario:

The scenario status view for a running load test.
Live Metrics
The graph on top of the scenario status table is updated while the load test is running. It displays information on the number of currently active users as well as the user limit for each test scenario. Hovering over the graph displays a popup with the values for this point in time (user limit in parentheses).
Since there might be a lot of information, you can filter in the dropdown for single or several test scenarios or just display total values. If you want to see more details in the chart, selecting a higher scaling factor will make the chart taller.
Red vertical bars are displayed when scenario errors occurred. These are bound to the respective scenarios, i.e. when you select a single scenario only the errors for this scenario will be visible in the graph. When you select Total, the sum of all scenario errors will be displayed.
Please note that there may be gaps in the live metrics even though the test was running fine during that time - this might happen due to a restart or relocation of the status updater (which regularly fetches the test status from the agents). Also, if the status updater does not receive any status from the agents for whatever reason, the charts will contain a gap for that period.
The data for the scenario status chart is available for a limited period of time only (7 days after the load test has ended). After that time the chart will no longer be displayed as it would be empty anyway.